
- 02/06/2023
- Posted by: Thamizharasu Gopalsamy
- Categories: Business Growth, Management

In today’s complex and competitive business environment, making strategic decisions about product portfolio management is a critical challenge. One tool that has stood the test of time in aiding such decisions is the Boston Matrix. This strategic planning tool, developed by the Boston Consulting Group, helps businesses analyze their product portfolio and make informed decisions about resource allocation. This comprehensive guide will delve into the Boston Matrix’s origins, components, uses, and how it has evolved for the digital age. We’ll also explore common misconceptions, compare them with other strategic tools, and contemplate their future. Whether you’re new to the Boston Matrix or looking to deepen your understanding, this guide has got you covered.
1. Understanding the Boston Matrix: An Overview
The Boston Matrix, also known as the Boston Consulting Group (BCG) Matrix or Product Portfolio Matrix, is a strategic business tool designed to aid companies in the process of product management and strategic decision-making. Devised in the 1970s by the Boston Consulting Group, it has become a staple model in business strategy courses and in real-world business planning.
This matrix helps businesses analyze their product portfolio and prioritize investments among different business units or product lines. The Boston Matrix visualizes a company’s offerings based on its relative market share and market growth rate. The goal of this matrix is to balance the deployment of resources among products to ensure long-term profitability and growth.
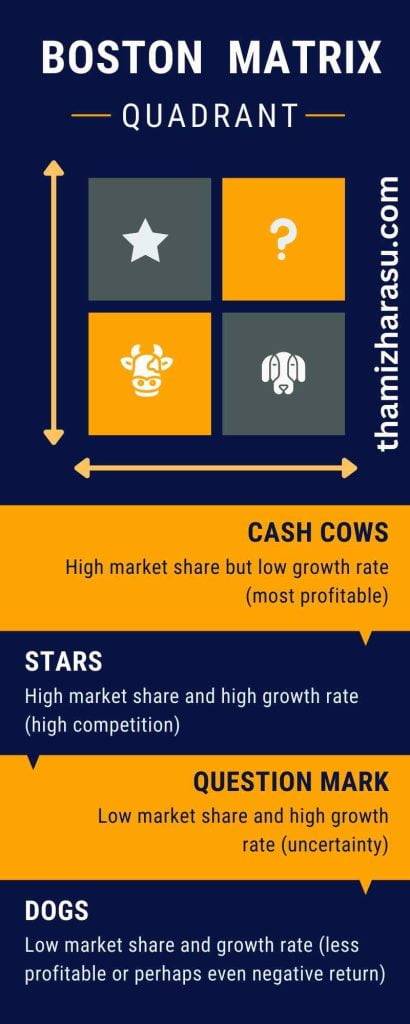
The Boston Matrix is divided into four quadrants, each representing a type of product in the company’s portfolio:
1. Stars: Products that have a high market share in high-growth markets. These are the leaders in the business and are potentially high-profit products.
2. Question Marks: These are products with a low market share in high-growth markets. They require substantial investment to improve their market position. They have potential but also carry a great deal of risk.
3. Cash Cows: Products with a high market share in low-growth markets. These products are typically the foundation of the company, bringing in steady revenue and profits that can be invested into Stars and Question Marks.
4. Dogs: Products with a low market share in low-growth markets. They are considered to be cash traps as they may not generate enough revenue or profits and may require decision-making concerning their continuation.
Understanding and using the Boston Matrix can be critical to a company’s success. It helps businesses gain insights into their product performance, make informed decisions about where to invest, disinvest, or develop new products, and ultimately, create a balanced and successful product portfolio.
2. Origins of the Boston Matrix: The Boston Consulting Group
The origins of the Boston Matrix trace back to the 1970s, when it was created by the Boston Consulting Group (BCG), a renowned global management consulting firm headquartered in Boston, Massachusetts. The BCG is known for its contributions to business strategy and for developing innovative business models and tools, one of the most prominent being the Boston Matrix.
The Boston Matrix was developed in response to the need for businesses to manage their product portfolios more strategically. At that time, companies were expanding their product ranges and venturing into different markets, necessitating a tool that could help in the strategic management of these diverse portfolios. Bruce Henderson, the founder of BCG, conceived the Boston Matrix as a way for companies to visualize their product or business unit portfolio in terms of their market share and market growth potential, thus helping in making strategic business decisions.
The matrix was created under the presumption of the product life cycle theory and the experience curve. The product life cycle theory suggests that a product’s profitability varies at different stages of its life—introduction, growth, maturity, and decline. Meanwhile, the experience curve hypothesizes that the cost of producing a product or service decreases the more you produce and learn about it.
The Boston Matrix aims to strike a balance in a company’s product portfolio, where profits from mature products (Cash Cows) can be reinvested into new, promising ones (Stars and Question Marks). It provides a simple, graphical way to analyze and compare various products within a company’s portfolio, leading to insights that can drive strategic decision-making.
Over the years, the Boston Matrix has become a classic strategic tool in the business world, assisting many organizations in effective portfolio management and strategic investment decision-making.
3. Key Components of the Boston Matrix
The Boston Matrix is divided into four quadrants, each representing a different kind of product or business unit based on its market share and market growth rate. These four categories are:
1. Stars: Stars are units with a high market share in a high-growth industry. They are the primary units a company should invest in, as they are or will soon become the leaders in the business, given the right amount of focus and investment. However, Stars can also absorb large amounts of cash because of their high growth rate, as they need to be financed to sustain their lead.
2. Cash Cows: Cash Cows are units with a high market share in a mature, slow-growing industry. They require little investment, as the market’s growth rate is low. Cash Cows generate more cash than required to maintain their market share. They are regarded as the bread and butter of the company, supplying the funds needed to invest in other areas, like Stars or Question Marks.
3. Question Marks: Also referred to as Problem Children, Question Marks are units with a low market share in a high-growth market. They are potentially the Stars of the future, and deciding which Question Marks to invest in and which to abandon is a significant challenge. They require a lot of resources to increase market share. If this is successful, Question Marks become Stars; if not, they may turn into Dogs.
4. Dogs: Dogs are units with a low market share in a mature, slow-growing industry. They may generate enough cash to sustain themselves but do not promise to be large sources of cash flow. In many cases, Dogs may be liquidated, divested, or repositioned unless they are needed to complement or boost the performance of other units or for competitive reasons.
These four categories help companies analyze and balance their product portfolio. The ultimate goal is to have an optimal balance of Stars, Cash Cows, Question Marks, and Dogs in the product portfolio, resulting in a successful and prosperous business in the long run.
4. How to Plot the Boston Matrix: A Step-by-step Guide
Creating a Boston Matrix is a strategic process that involves several steps. Here’s a step-by-step guide to help you plot the Boston Matrix:
Step 1: Identify your product portfolio
Make a list of all the products or business units that you want to plot on the matrix. These can be individual products, product lines, services, or business units within a larger organization.
Step 2: Determine the market growth rate
Assess the market growth rate for each product or business unit. You can do this by researching industry trends, examining market reports, or using your own business data if you have it.
Step 3: Calculate the relative market share
Determine the relative market share of each product or business unit. This can be done by comparing your product’s market share to the market share of your largest competitor in the same market.
Step 4: Plot each product on the matrix
Now, plot each product or business unit on the matrix based on their market growth rate (Y-axis) and relative market share (X-axis). This will categorize them into one of the four quadrants: Star, Question Mark, Cash Cow, or Dog.
Step 5: Analyze the Matrix
Once all products or business units are plotted, analyze the matrix. If a product is a Star, it’s in a high-growth market and it’s doing well. If it’s a Question Mark, it’s in a high-growth market but isn’t performing well. Cash Cows are in a low-growth market but have a high market share, and Dogs have a low market share in a low-growth market.
Step 6: Make strategic decisions
Use your matrix as a starting point to make strategic decisions. This might involve investing more in Stars, considering whether to continue with Dogs, determining which Question Marks could become Stars with more investment, and leveraging the reliable income from Cash Cows to fund other ventures.
Remember, the Boston Matrix is a tool that should be used as part of a wider strategic analysis. It’s a great starting point for discussions about your product portfolio and strategy, but it should not be used in isolation. Other factors and market conditions should also be considered.
5. Using the Boston Matrix for Strategic Decision Making
The Boston Matrix is an essential strategic tool designed to aid in business decision-making, particularly around product portfolio management and resource allocation. Here’s how it can be applied to strategic decision-making:
1. Resource Allocation: The Boston Matrix helps businesses understand where to allocate resources. For example, Star products may require continued investment to capitalize on their growth potential, while Question Marks may require investment to improve their market position. Cash Cows, being already successful, may need less investment but should be maintained to finance other quadrants. Dogs, on the other hand, may not warrant further investment and could be considered for divestment.
2. Product Development: Understanding the placement of products in the Boston Matrix can inform product development decisions. For instance, if a product is identified as a Star, it may be worthwhile to invest in further developing and enhancing that product to maximize its market potential. If a product is a Dog, the company may decide to discontinue its production.
3. Portfolio Management: By visualizing a company’s product portfolio, the Boston Matrix enables businesses to strike a balance between high-growth Stars and stable Cash Cows, ensuring both short-term profitability and long-term growth.
4. Risk Management: The Boston Matrix can help manage risk by diversifying a company’s portfolio. Having a balanced portfolio – a mix of Stars, Cash Cows, Question Marks, and Dogs – can help businesses mitigate risks associated with market volatility.
5. Strategic Growth Planning: The Boston Matrix can also guide strategic growth decisions. For example, if there are too many Dogs and not enough Stars or Cash Cows, it might be time to consider new growth strategies or potentially restructuring the business.
6. Investment Decisions: The matrix can also be used to determine which products should receive investment. Stars and certain Question Marks may deserve more funding, while Dogs may be better off divested.
It’s important to remember that while the Boston Matrix is a powerful tool, it should be used as part of a broader strategic context that considers other factors such as market competition, profitability, and the company’s overall strategic goals.
6. Boston Matrix Case Study: Real-World Applications
Boston Matrix has been used by two major global companies: Apple and Unilever.
1. Apple
Apple’s product portfolio can be easily mapped onto the Boston Matrix, offering insight into its product strategy:
Stars: The iPhone is arguably Apple’s Star product. It operates in a high-growth market and holds a significant market share. Apple continues to innovate and invest heavily in this product, maintaining its market leadership.
Cash Cows: Products like the MacBook and the iPad can be seen as Apple’s Cash Cows. These are mature products with a considerable market share in relatively slow-growing markets. They generate a steady cash flow which can be used to fund other business ventures.
Question Marks: In recent years, the Apple Watch and other wearables may have started as Question Marks, being new products in high-growth markets but initially having a relatively small market share. With investment and strategic marketing, these products have the potential to become Stars.
Dogs: Apple has had few Dogs, but some discontinued products like the iPod or the HomePod could be classified as such. These products had a low market share in a mature or declining market, and Apple made strategic decisions to discontinue these products.
2. Unilever
Unilever, a multinational consumer goods company, also has a diversified portfolio that can be evaluated using the Boston Matrix:
Stars: Dove, one of Unilever’s most popular personal care brands, can be seen as a Star with its strong market share in the growing personal care market.
Cash Cows: Brands like Lipton, operating in the mature tea market, are Cash Cows, generating steady profits that can be used to invest in other areas of Unilever’s business.
Question Marks: Newer or less established brands in high-growth markets, such as eco-friendly and sustainable brands, might be considered Question Marks. These brands require investment and strategic marketing to increase their market share.
Dogs: Some of Unilever’s less popular or underperforming brands in mature markets may fall under the category of Dogs. Unilever might need to make strategic decisions about whether to continue investing in these brands.
In both cases, the Boston Matrix provides valuable insights into the product portfolio, helping these companies to make strategic decisions about resource allocation, product development, and portfolio management.
7. Comparing the Boston Matrix with other Strategic Tools
The Boston Matrix is just one of many strategic planning tools businesses can use to analyze their situation and make informed decisions. Let’s compare it with two other common tools: SWOT Analysis and Ansoff Matrix.
Boston Matrix vs. SWOT Analysis
SWOT Analysis stands for Strengths, Weaknesses, Opportunities, and Threats. It’s a tool that helps companies understand their internal strengths and weaknesses as well as the external opportunities and threats they face.
The Boston Matrix and SWOT Analysis are used for different purposes. While the Boston Matrix focuses on product portfolio management, SWOT Analysis offers a broader view of the company’s strategic position. SWOT Analysis helps with understanding the internal and external factors that can affect the business, but it doesn’t give detailed insights into individual product performance or specific strategic actions for products.
However, these tools can be used in conjunction. For instance, SWOT Analysis can identify overall strategic directions, while the Boston Matrix can then be used to understand how different products or business units can contribute to these strategies.
Boston Matrix vs. Ansoff Matrix
The Ansoff Matrix is another strategic planning tool that helps businesses decide their product and market growth strategy. It provides four strategies: Market Penetration (existing markets, existing products), Market Development (new markets, existing products), Product Development (existing markets, new products), and Diversification (new markets, new products).
The Boston Matrix and Ansoff Matrix complement each other rather well. While the Boston Matrix helps in identifying where to invest or disinvest among current products, the Ansoff Matrix can guide the development of growth strategies based on whether the focus should be on existing or new products/markets.
In a nutshell, these tools serve different purposes but can be used together for a more comprehensive strategic analysis. The Boston Matrix is especially useful when a company has a diverse product portfolio and needs to determine how to allocate resources among these products. However, it should be complemented with other strategic tools that consider the broader internal and external business environment.
8. Common Misconceptions and Mistakes in Using the Boston Matrix
The Boston Matrix is a highly useful strategic tool when used correctly, but it’s not without its potential pitfalls. Here are some common misconceptions and mistakes to watch out for:
1. Over-reliance on the Matrix: Some businesses make the mistake of using the Boston Matrix as their sole decision-making tool. While it’s a powerful visual aid, it should be used as part of a broader strategic analysis, complemented by other tools and considering other factors like profitability, competitive positioning, and strategic fit with the company’s overall goals.
2. Neglecting Market Dynamics: Another common misconception is assuming that market growth and relative market share are static. They aren’t. Markets evolve, competitors come and go, and a company’s offerings can gain or lose market share. It’s crucial to frequently update your Boston Matrix to reflect these changes.
3. Misinterpreting Categories: Each quadrant of the Boston Matrix comes with a general strategic direction (e.g., invest in Stars, consider divesting Dogs). However, these aren’t one-size-fits-all prescriptions. For instance, a Dog product might be worth keeping if it supports a Star product or serves a strategic purpose.
4. Assuming Equal Importance of Quadrants: It’s easy to assume that all four quadrants should be equal in size or number of products, but this isn’t necessarily the case. The optimal mix of Stars, Cash Cows, Question Marks, and Dogs varies depending on factors like the company’s strategy, industry characteristics, and stage of the business life cycle.
5. Misjudging Market Definitions: Defining the market too broadly or too narrowly can skew your understanding of market growth and relative market share. Be careful to define your market in a way that accurately represents your competitive landscape.
6. Ignoring Profitability: The Boston Matrix doesn’t directly consider profitability, which is a crucial aspect of strategic decision-making. A Cash Cow, for example, might have a high market share but low profit margins. Be sure to consider profitability alongside the Boston Matrix.
By being aware of these common mistakes and misconceptions, you can avoid them and make more effective use of the Boston Matrix in your strategic planning.
9. Updating the Boston Matrix for the Digital Age
In today’s rapidly changing digital era, businesses must be more adaptive and responsive than ever. The Boston Matrix, while developed in the 1970s, remains a robust framework but requires some tweaks to remain relevant in our digital age.
1. Incorporating Digital Metrics: Traditional metrics of market share and growth may not be sufficient in the digital world. For example, user engagement, online sentiment, digital market share, and other data-driven insights could be integrated into the matrix to give a more rounded understanding of a product’s position.
2. Accounting for Speed: The digital age is characterized by rapid change. Products can move through the quadrants much faster than before. Companies must regularly update their Boston Matrix to reflect these changes.
3. Recognizing Digital Products: The Boston Matrix can be used for digital as well as physical products. For instance, an app could be a Star, a well-established software could be a Cash Cow, a new digital venture could be a Question Mark, and an outdated online service could be a Dog.
4. Considering Network Effects: In many digital markets, network effects play a significant role. A product becomes more valuable as more people use it (think social media platforms like Facebook or marketplace platforms like Amazon). The network effect can cause a ‘winner-takes-all’ situation, making it difficult for products with a low relative market share to compete. The Boston Matrix should be interpreted in light of such industry dynamics.
5. Emphasizing Innovation and Adaptation: With the rapid pace of digital transformation, Stars and Question Marks are especially important as they represent areas where the company can innovate and adapt. Maintaining a strong focus on these areas can be crucial for staying competitive in the digital age.
By integrating these considerations, the Boston Matrix can continue to be a valuable tool for strategic decision-making in the digital age. However, as always, it should be used as part of a wider suite of tools and should be adapted to fit the unique characteristics of each business and market context.
10. The Future of the Boston Matrix: Predictions and Possibilities
The Boston Matrix remains a useful tool for strategic planning, but as with all models, it must continue to evolve to stay relevant. Here are some predictions and possibilities for its future:
1. Increased Integration with Data Analytics: As companies continue to collect and analyze vast amounts of data, the Boston Matrix will likely be integrated with more complex data analytics. Advanced data analytics can provide deeper insights into market growth rates, relative market share, and other crucial metrics that inform the placement of products or business units in the matrix. Machine learning and AI might also play a role in enhancing the Matrix’s analytical capabilities.
2. Adaptation to Fast-Paced Change: With the accelerating pace of technological change, market dynamics are more volatile than ever. This may lead to a more dynamic version of the Boston Matrix, where products move more frequently between quadrants. It may also require a greater emphasis on Stars and Question Marks, which represent innovation and potential growth.
3. Consideration of Sustainability Factors: As businesses increasingly focus on sustainability, this factor might become a key consideration in the Boston Matrix. For instance, a product might be a cash cow but have significant environmental impacts. This could lead to a revised matrix that considers both financial and sustainability factors, helping businesses make decisions that balance profitability with environmental and social responsibility.
4. Integration with Other Models: We can expect to see the Boston Matrix integrated with other models more often, creating a more holistic strategic planning tool. For instance, it could be combined with SWOT analysis for a more comprehensive view of a company’s internal and external environment, or with the Ansoff Matrix to better inform growth strategies.
The Boston Matrix has stood the test of time so far, but its future relevance will depend on its ability to adapt to these and other emerging trends. With the right adaptations, it can continue to serve as a powerful tool for strategic decision-making in the future.
Conclusion:
The Boston Matrix has remained a relevant and robust strategic planning tool since its inception, offering businesses a visual and straightforward method to manage their product portfolio. However, as the business world evolves – particularly with the advent of the digital age and increased emphasis on sustainability – it’s critical for the Matrix to adapt accordingly. While the Boston Matrix offers valuable insights, remember it’s one of many tools in your strategic toolkit. Use it alongside other models and in the context of your unique business context for the most effective strategic decision-making. Here’s to leveraging the power of the Boston Matrix for your business success!
Are you looking forward to next-level business growth? Kindly register below and we will explain how we are helping to accelerate business growth. it will be helpful for your incredible business growth before you ever thought possible. SUBMIT the form below.